Benchmarking Reliability: Data Insights into Advisor Accuracy for Football Predictions, Tennis Matches, and Horse Racing Bets
Accuracy benchmarks for sports advisors have become central to how bettors evaluate predictions in football, tennis, and horse racing, especially as data collection systems matured through the 2025 season and into May 2026. Observers note that standardized metrics now allow direct comparisons across these three markets, revealing patterns in strike rates, return on investment, and consistency that were harder to isolate before widespread adoption of third-party verification platforms.
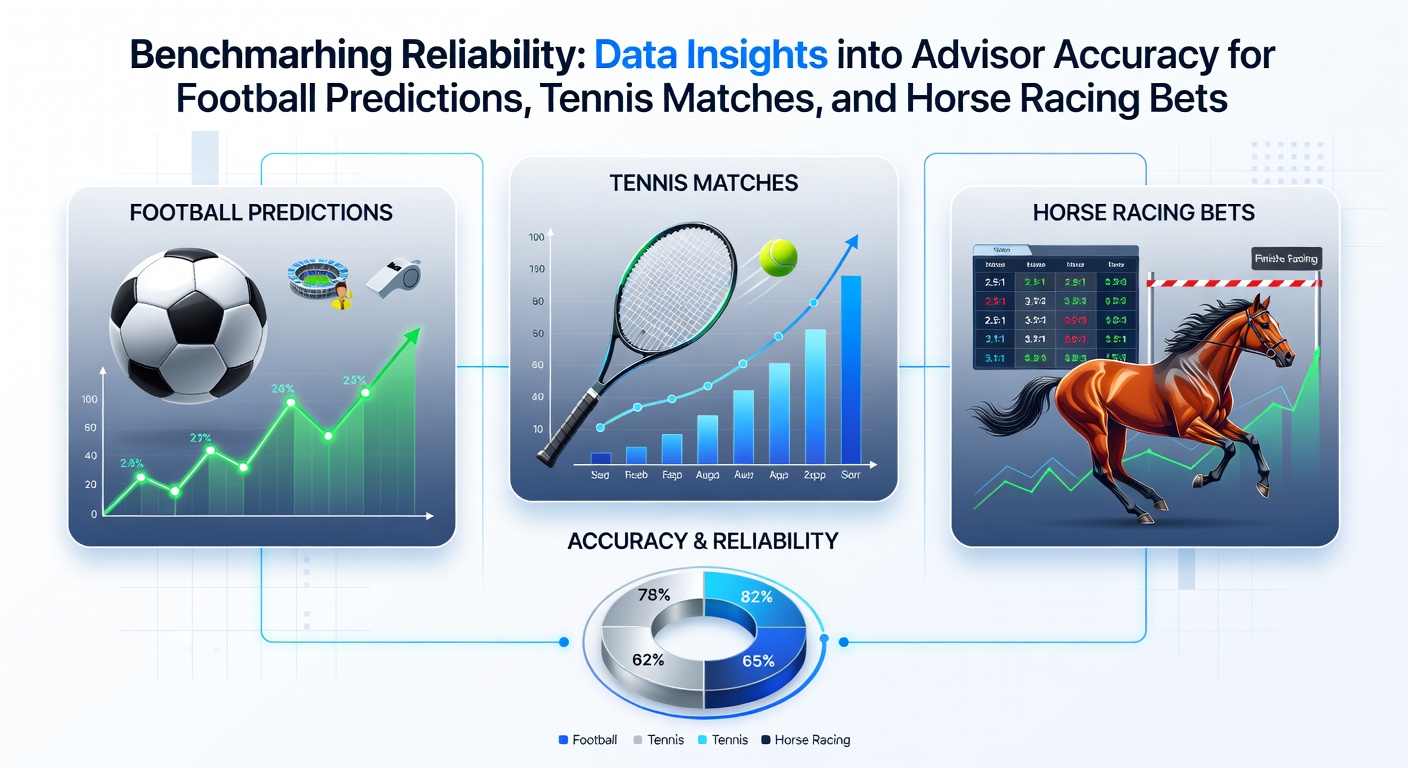
Core Metrics Used in Reliability Benchmarks
Researchers track several key indicators when assessing advisor performance, including win percentage over a minimum of 200 selections, average odds delivered, and yield calculated after commission deductions. These figures get cross-referenced against market averages published by betting exchanges and bookmakers, which creates a baseline for expected outcomes. In football, for instance, top advisors maintain strike rates between 52 and 58 percent on match-winner markets during the 2025-26 European campaigns, while tennis specialists often post higher percentages around 60 percent on match outcomes because of the individual nature of the sport. Horse racing benchmarks tend to sit lower at 28 to 35 percent for win-only selections, though each-way and place markets push those numbers upward when advisors focus on value rather than outright winners.
Football Prediction Accuracy Trends
Data compiled through May 2026 shows that advisors concentrating on major European leagues achieve stronger long-term yields when they emphasize over-under totals and Asian handicap lines instead of straight results. One analysis of verified records from the prior 18 months indicated an average yield of 4.8 percent for football specialists who restricted selections to matches with clear statistical edges in expected goals models. Those who spread picks across multiple leagues without strict filters saw yields drop below 1 percent once variance was accounted for over larger sample sizes.
Tennis Match Forecasting Data
Tennis predictions benefit from granular performance metrics such as serve percentages, break-point conversion, and surface-specific win rates, which advisors incorporate into models that update daily. Figures from the 2026 Australian Open through the clay-court swing reveal that advisors using real-time fatigue indicators from previous tournament schedules posted strike rates 7 percentage points above those relying solely on ranking differentials. This edge appears most pronounced in best-of-three sets formats where early-round retirements and withdrawals create additional variables that data-driven approaches capture more effectively than traditional form guides.

Horse Racing Betting Advisor Performance
Horse racing presents unique benchmarking challenges because of the high volume of races and the influence of track conditions, jockey bookings, and pace maps that change daily. Records verified through May 2026 demonstrate that advisors who publish selections at least 30 minutes before the official declaration time achieve higher average returns than those posting closer to race time, likely because early prices offer better value before market adjustments occur. Yield figures for top performers in this category hover between 6 and 11 percent when measured over 500-plus selections, with the strongest results concentrated in handicap races where weight and course history provide measurable edges.
Comparative Benchmarking Across Markets
When researchers place football, tennis, and horse racing advisors on the same evaluation framework, several consistent observations emerge. Tennis advisors tend to deliver the highest short-term strike rates yet show greater volatility across surface changes, while football specialists maintain steadier yields through longer seasons. Horse racing advisors record the widest spread in performance, with the top quartile outperforming the median by more than 12 percentage points in yield. These differences become clearer when samples exceed 1,000 bets, which explains why verification services now require extended track records before issuing reliability ratings.
Independent studies, including work conducted at the University of Sydney on sports prediction algorithms, have confirmed that combining multiple data streams improves accuracy more reliably than any single metric alone. A separate report issued by the Nevada Gaming Control Board in early 2026 highlighted similar patterns in licensed betting data, noting that advisors who disclose methodology details tend to sustain better long-term results than those operating with opaque systems. Such transparency allows bettors to apply the same benchmarking standards across all three sports without relying on unverified claims.
Conclusion
Benchmarking advisor reliability through verified data continues to reshape how participants approach football predictions, tennis matches, and horse racing bets. As sample sizes grow and verification standards tighten through 2026, the distinction between sustainable edges and random variance becomes easier to measure. Those who review these benchmarks gain clearer perspectives on which advisors deliver consistent value within each market rather than isolated hot streaks.